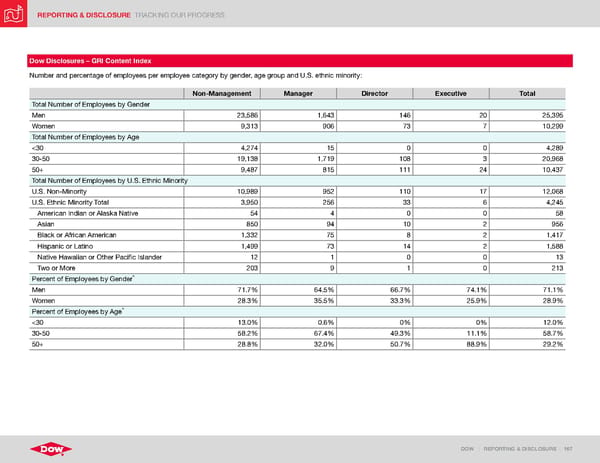
REPORTING & DISCLOSURE TRACKING OUR PROGRESS DOW | REPORTING & DISCLOSURE | 167 Dow Disclosures – GRI Content Index Number and percentage of employees per employee category by gender, age group and U.S. ethnic minority: Non-Management Manager Director Executive Total Total Number of Employees by Gender Men 23,586 1,643 146 20 25,395 Women 9,313 906 73 7 10,299 Total Number of Employees by Age <30 4,274 15 0 0 4,289 30-50 19,138 1,719 108 3 20,968 50+ 9,487 815 111 24 10,437 Total Number of Employees by U.S. Ethnic Minority U.S. Non-Minority 10,989 952 110 17 12,068 U.S. Ethnic Minority Total 3,950 256 33 6 4,245 American Indian or Alaska Native 54 4 0 0 58 Asian 850 94 10 2 956 Black or African American 1,332 75 8 2 1,417 Hispanic or Latino 1,499 73 14 2 1,588 Native Hawaiian or Other Pacific Islander 12 1 0 0 13 Two or More 203 9 1 0 213 Percent of Employees by Gender ^ Men 71.7% 64.5% 66.7% 74.1% 71.1% Women 28.3% 35.5% 33.3% 25.9% 28.9% Percent of Employees by Age ^ <30 13.0% 0.6% 0% 0% 12.0% 30-50 58.2% 67.4% 49.3% 11.1% 58.7% 50+ 28.8% 32.0% 50.7% 88.9% 29.2%
 ESG Report | Dow Page 166 Page 168