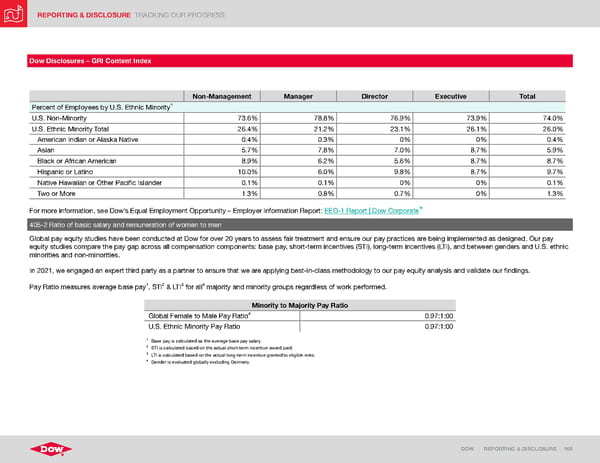
REPORTING & DISCLOSURE TRACKING OUR PROGRESS DOW | REPORTING & DISCLOSURE | 168 Dow Disclosures – GRI Content Index Non-Management Manager Director Executive Total Percent of Employees by U.S. Ethnic Minority ^ U.S. Non-Minority 73.6% 78.8% 76.9% 73.9% 74.0% U.S. Ethnic Minority Total 26.4% 21.2% 23.1% 26.1% 26.0% American Indian or Alaska Native 0.4% 0.3% 0% 0% 0.4% Asian 5.7% 7.8% 7.0% 8.7% 5.9% Black or African American 8.9% 6.2% 5.6% 8.7% 8.7% Hispanic or Latino 10.0% 6.0% 9.8% 8.7% 9.7% Native Hawaiian or Other Pacific Islander 0.1% 0.1% 0% 0% 0.1% Two or More 1.3% 0.8% 0.7% 0% 1.3% For more information, see Dow’s Equal Employment Opportunity – Employer Information Report: EEO-1 Report | Dow Corporate 405-2 Ratio of basic salary and remuneration of women to men Global pay equity studies have been conducted at Dow for over 20 years to assess fair treatment and ensure our pay practices are being implemented as designed. Our pay equity studies compare the pay gap across all compensation components: base pay, short-term incentives (STI), long-term incentives (LTI), and between genders and U.S. ethnic minorities and non-minorities. In 2021, we engaged an expert third party as a partner to ensure that we are applying best-in-class methodology to our pay equity analysis and validate our findings. Pay Ratio measures average base pay 1 , STI 2 & LTI 3 for all 4 majority and minority groups regardless of work performed. Minority to Majority Pay Ratio Global Female to Male Pay Ratio 4 0.97:1:00 U.S. Ethnic Minority Pay Ratio 0.97:1:00 1 Base pay is calculated as the average base pay salary. 2 STI is calculated based on the actual short-term incentive award paid. 3 LTI is calculated based on the actual long-term incentive granted to eligible roles. 4 Gender is evaluated globally excluding Germany.
 ESG Report | Dow Page 167 Page 169