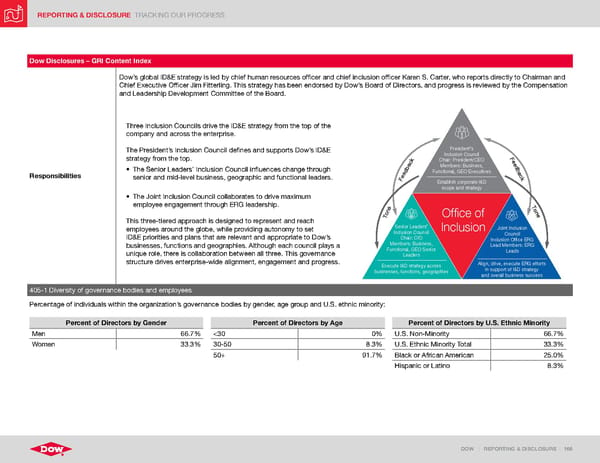
REPORTING & DISCLOSURE TRACKING OUR PROGRESS DOW | REPORTING & DISCLOSURE | 166 Dow Disclosures – GRI Content Index Responsibilities Dow’s global ID&E strategy is led by chief human resources officer and chief inclusion officer Karen S. Carter, who reports directly to Chairman and Chief Executive Officer Jim Fitterling. This strategy has been endorsed by Dow’s Board of Directors, and progress is reviewed by the Compensation and Leadership Development Committee of the Board. Three Inclusion Councils drive the ID&E strategy from the top of the company and across the enterprise. The President’s Inclusion Council defines and supports Dow’s ID&E strategy from the top. • The Senior Leaders’ Inclusion Council influences change through senior and mid-level business, geographic and functional leaders. • The Joint Inclusion Council collaborates to drive maximum employee engagement through ERG leadership. This three-tiered approach is designed to represent and reach employees around the globe, while providing autonomy to set ID&E priorities and plans that are relevant and appropriate to Dow’s businesses, functions and geographies. Although each council plays a unique role, there is collaboration between all three. This governance structure drives enterprise-wide alignment, engagement and progress. President’s Inclusion Council Chair: President/CEO Members: Business, Functional, GEO Executives Feedback Tone Establish corporate I&D scope and strategy Execute I&D strategy across businesses, functions, geographies Align, drive, execute ERG efforts in support of I&D strategy and overall business success Joint Inclusion Council Inclusion Office ERG Lead Members: ERG Leads Office of Inclusion Senior Leaders’ Inclusion Council Chair: CIO Members: Business, Functional, GEO Senior Leaders Feedback Tone 405-1 Diversity of governance bodies and employees Percentage of individuals within the organization’s governance bodies by gender, age group and U.S. ethnic minority: Percent of Directors by Gender Percent of Directors by Age Percent of Directors by U.S. Ethnic Minority Men 66.7% <30 0% U.S. Non-Minority 66.7% Women 33.3% 30-50 8.3% U.S. Ethnic Minority Total 33.3% 50+ 91.7% Black or African American 25.0% Hispanic or Latino 8.3%
 ESG Report | Dow Page 165 Page 167