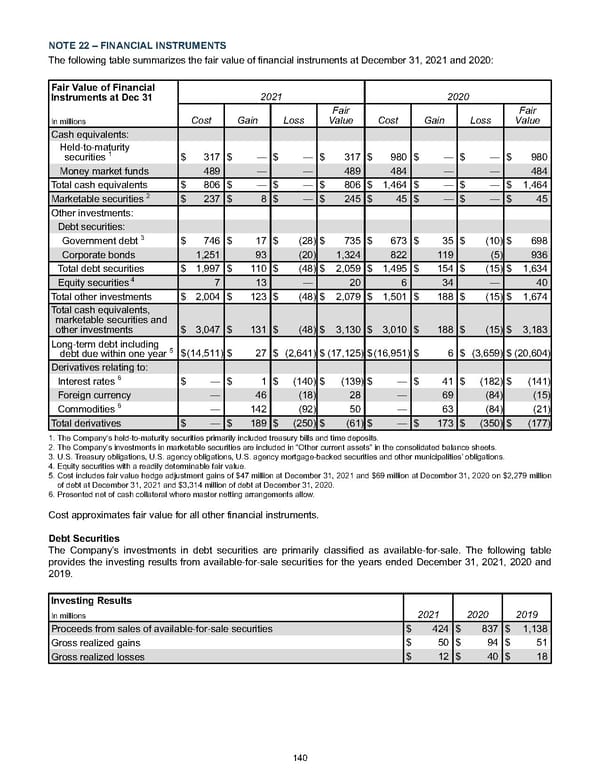
NOTE 22 – FINANCIAL INSTRUMENTS The following table summarizes the fair value of financial instruments at December 31, 2021 and 2020 : Fair Value of Financial Instruments at Dec 31 2021 2020 In millions Cost Gain Loss Fair Value Cost Gain Loss Fair Value Cash equivalents: Held-to-maturity securities 1 $ 317 $ — $ — $ 317 $ 980 $ — $ — $ 980 Money market funds 489 — — 489 484 — — 484 Total cash equivalents $ 806 $ — $ — $ 806 $ 1,464 $ — $ — $ 1,464 Marketable securities 2 $ 237 $ 8 $ — $ 245 $ 45 $ — $ — $ 45 Other investments: Debt securities: Government debt 3 $ 746 $ 17 $ (28) $ 735 $ 673 $ 35 $ (10) $ 698 Corporate bonds 1,251 93 (20) 1,324 822 119 (5) 936 Total debt securities $ 1,997 $ 110 $ (48) $ 2,059 $ 1,495 $ 154 $ (15) $ 1,634 Equity securities 4 7 13 — 20 6 34 — 40 Total other investments $ 2,004 $ 123 $ (48) $ 2,079 $ 1,501 $ 188 $ (15) $ 1,674 Total cash equivalents, marketable securities and other investments $ 3,047 $ 131 $ (48) $ 3,130 $ 3,010 $ 188 $ (15) $ 3,183 Long-term debt including debt due within one year 5 $ (14,511) $ 27 $ (2,641) $ (17,125) $ (16,951) $ 6 $ (3,659) $ (20,604) Derivatives relating to: Interest rates 6 $ — $ 1 $ (140) $ (139) $ — $ 41 $ (182) $ (141) Foreign currency — 46 (18) 28 — 69 (84) (15) Commodities 6 — 142 (92) 50 — 63 (84) (21) Total derivatives $ — $ 189 $ (250) $ (61) $ — $ 173 $ (350) $ (177) 1. The Company's held-to-maturity securities primarily included treasury bills and time deposits. 2. The Company's investments in marketable securities are included in "Other current assets" in the consolidated balance sheets. 3. U.S. Treasury obligations, U.S. agency obligations, U.S. agency mortgage-backed securities and other municipalities’ obligations. 4. Equity securities with a readily determinable fair value. 5. Cost includes fair value hedge adjustment gains of $47 million at December 31, 2021 and $69 million at December 31, 2020 on $2,279 million of deb t at December 31, 2021 and $3,314 million of debt at December 31, 2020 . 6. Presented net of cash collateral where master netting arrangements allow. Cost approximates fair value for all other financial instruments. Debt Securities The Company’s investments in debt securities are primarily classified as available-for-sale. The following table provides the investing results from available-for-sale securities for the years ended December 31, 2021 , 2020 and 2019 . Investing Results In millions 2021 2020 2019 Proceeds from sales of available-for-sale securities $ 424 $ 837 $ 1,138 Gross realized gains $ 50 $ 94 $ 51 Gross realized losses $ 12 $ 40 $ 18 140
 Annual Report Page 149 Page 151