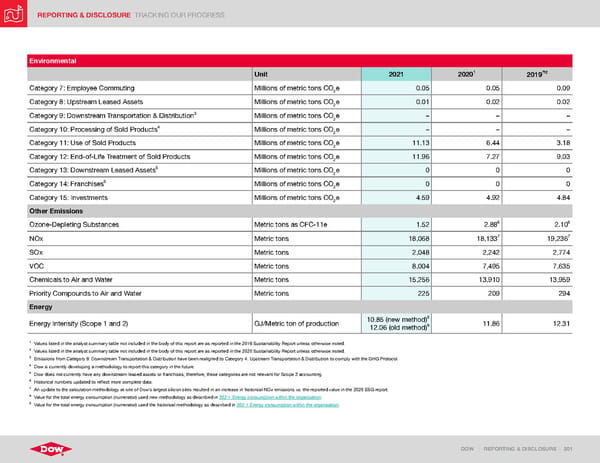
REPORTING & DISCLOSURE TRACKING OUR PROGRESS DOW | REPORTING & DISCLOSURE | 201 Environmental Unit 2021 2020 1 2019 2 Category 7: Employee Commuting Millions of metric tons CO 2 e 0.05 0.05 0.09 Category 8: Upstream Leased Assets Millions of metric tons CO 2 e 0.01 0.02 0.02 Category 9: Downstream Transportation & Distribution 3 Millions of metric tons CO 2 e – – – Category 10: Processing of Sold Products 4 Millions of metric tons CO 2 e – – – Category 11: Use of Sold Products Millions of metric tons CO 2 e 11.13 6.44 3.18 Category 12: End-of-Life Treatment of Sold Products Millions of metric tons CO 2 e 11.96 7.27 9.03 Category 13: Downstream Leased Assets 5 Millions of metric tons CO 2 e 0 0 0 Category 14: Franchises 5 Millions of metric tons CO 2 e 0 0 0 Category 15: Investments Millions of metric tons CO 2 e 4.59 4.92 4.84 Other Emissions Ozone-Depleting Substances Metric tons as CFC-11e 1.52 2.88 6 2.10 6 NOx Metric tons 18,068 18,133 7 19,236 7 SOx Metric tons 2,048 2,242 2,774 VOC Metric tons 8,004 7,495 7,635 Chemicals to Air and Water Metric tons 15,256 13,910 13,959 Priority Compounds to Air and Water Metric tons 225 209 294 Energy Energy Intensity (Scope 1 and 2) GJ/Metric ton of production 10.85 (new method) 8 12.06 (old method) 9 11.86 12.31 1 Values listed in the analyst summary table not included in the body of this report are as reported in the 2019 Sustainability Report unless otherwise noted. 2 Values listed in the analyst summary table not included in the body of this report are as reported in the 2020 Sustainability Report unless otherwise noted. 3 Emissions from Category 9: Downstream Transportation & Distribution have been realigned to Category 4: Upstream Transportation & Distribution to comply with the GHG Protocol. 4 Dow is currently developing a methodology to report this category in the future. 5 Dow does not currently have any downstream leased assets or franchises; therefore, these categories are not relevant for Scope 3 accounting. 6 Historical numbers updated to reflect more complete data. 7 An update to the calculation methodology at one of Dow’s largest silicon sites resulted in an increase in historical NOx emissions vs. the reported value in the 2020 ESG report. 8 Value for the total energy consumption (numerator) used new methodology as described in 302-1 Energy consumption within the organization . 9 Value for the total energy consumption (numerator) used the historical methodology as described in 302-1 Energy consumption within the organization .
 ESG Report | Dow Page 200 Page 202