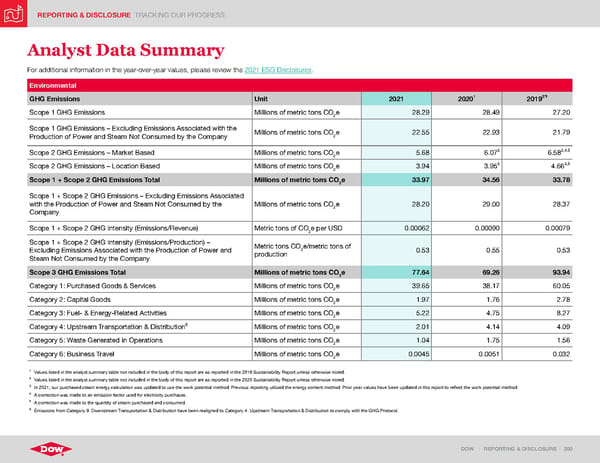
REPORTING & DISCLOSURE TRACKING OUR PROGRESS DOW | REPORTING & DISCLOSURE | 200 Analyst Data Summary For additional information in the year-over-year values, please review the 2021 ESG Disclosures . Environmental GHG Emissions Unit 2021 2020 1 2019 2 Scope 1 GHG Emissions Millions of metric tons CO 2 e 28.29 28.49 27.20 Scope 1 GHG Emissions – Excluding Emissions Associated with the Production of Power and Steam Not Consumed by the Company Millions of metric tons CO 2 e 22.55 22.93 21.79 Scope 2 GHG Emissions – Market Based Millions of metric tons CO 2 e 5.68 6.07 3 6.58 3,4,5 Scope 2 GHG Emissions – Location Based Millions of metric tons CO 2 e 3.94 3.95 3 4.66 3,5 Scope 1 + Scope 2 GHG Emissions Total Millions of metric tons CO 2 e 33.97 34.56 33.78 Scope 1 + Scope 2 GHG Emissions – Excluding Emissions Associated with the Production of Power and Steam Not Consumed by the Company Millions of metric tons CO 2 e 28.20 29.00 28.37 Scope 1 + Scope 2 GHG Intensity (Emissions/Revenue) Metric tons of CO 2 e per USD 0.00062 0.00090 0.00079 Scope 1 + Scope 2 GHG Intensity (Emissions/Production) – Excluding Emissions Associated with the Production of Power and Steam Not Consumed by the Company Metric tons CO 2 e/metric tons of production 0.53 0.55 0.53 Scope 3 GHG Emissions Total Millions of metric tons CO 2 e 77.64 69.26 93.94 Category 1: Purchased Goods & Services Millions of metric tons CO 2 e 39.65 38.17 60.05 Category 2: Capital Goods Millions of metric tons CO 2 e 1.97 1.76 2.78 Category 3: Fuel- & Energy-Related Activities Millions of metric tons CO 2 e 5.22 4.75 8.27 Category 4: Upstream Transportation & Distribution 6 Millions of metric tons CO 2 e 2.01 4.14 4.09 Category 5: Waste Generated in Operations Millions of metric tons CO 2 e 1.04 1.75 1.56 Category 6: Business Travel Millions of metric tons CO 2 e 0.0045 0.0051 0.032 1 Values listed in the analyst summary table not included in the body of this report are as reported in the 2019 Sustainability Report unless otherwise noted. 2 Values listed in the analyst summary table not included in the body of this report are as reported in the 2020 Sustainability Report unless otherwise noted. 3 In 2021, our purchased steam energy calculation was updated to use the work potential method. Previous reporting utilized the energy content method. Prior year values have been updated in this report to reflect the work potential method. 4 A correction was made to an emission factor used for electricity purchases. 5 A correction was made to the quantity of steam purchased and consumed. 6 Emissions from Category 9: Downstream Transportation & Distribution have been realigned to Category 4: Upstream Transportation & Distribution to comply with the GHG Protocol.
 ESG Report | Dow Page 199 Page 201