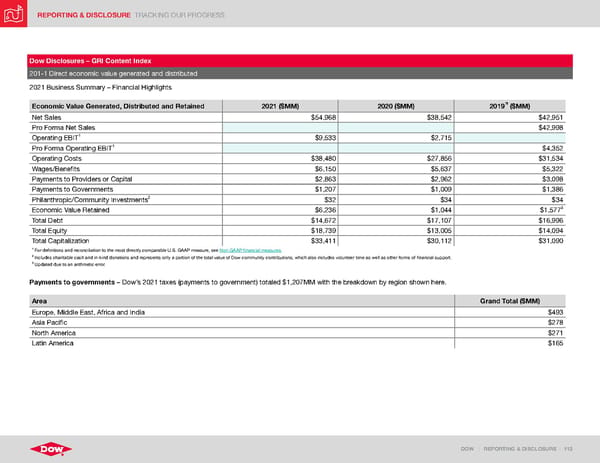
REPORTING & DISCLOSURE TRACKING OUR PROGRESS DOW | REPORTING & DISCLOSURE | 112 Dow Disclosures – GRI Content Index 201-1 Direct economic value generated and distributed 2021 Business Summary – Financial Highlights Economic Value Generated, Distributed and Retained 2021 ($MM) 2020 ($MM) 2019 ($MM) Net Sales $54,968 $38,542 $42,951 Pro Forma Net Sales $42,998 Operating EBIT 1 $9,533 $2,715 Pro Forma Operating EBIT 1 $4,352 Operating Costs $38,480 $27,856 $31,534 Wages/Benefits $6,150 $5,637 $5,322 Payments to Providers or Capital $2,863 $2,962 $3,098 Payments to Governments $1,207 $1,009 $1,386 Philanthropic/Community Investments 2 $32 $34 $34 Economic Value Retained $6,236 $1,044 $1,577 3 Total Debt $14,672 $17,107 $16,996 Total Equity $18,739 $13,005 $14,094 Total Capitalization $33,411 $30,112 $31,090 1 For definitions and reconciliation to the most directly comparable U.S. GAAP measure, see Non-GAAP financial measures . 2 Includes charitable cash and in-kind donations and represents only a portion of the total value of Dow community contributions, which also includes volunteer time as well as other forms of financial support. 3 Updated due to an arithmetic error. Payments to governments – Dow’s 2021 taxes (payments to government) totaled $1,207MM with the breakdown by region shown here. Area Grand Total ($MM) Europe, Middle East, Africa and India $493 Asia Pacific $278 North America $271 Latin America $165
 ESG Report | Dow Page 111 Page 113