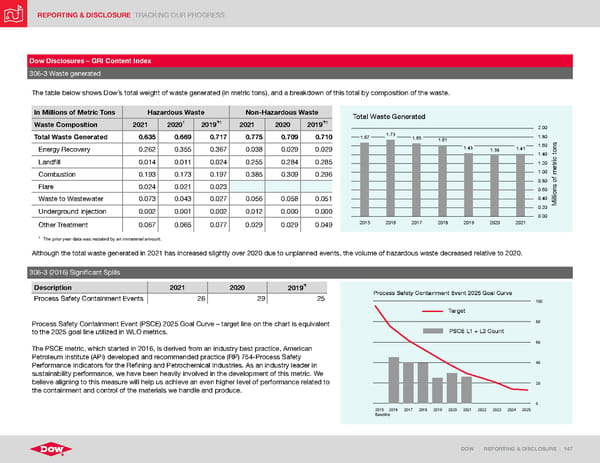
REPORTING & DISCLOSURE TRACKING OUR PROGRESS DOW | REPORTING & DISCLOSURE | 147 Dow Disclosures – GRI Content Index 306-3 Waste generated The table below shows Dow’s total weight of waste generated (in metric tons), and a breakdown of this total by composition of the waste. In Millions of Metric Tons Hazardous Waste Non-Hazardous Waste Total Waste Generated 1.38 1.61 0.00 0.20 0.40 0.60 0.80 1.00 1.20 1.40 1.60 1.80 2.00 2021 2020 2019 2018 2017 2016 2015 Millions of metric tons 1.67 1.65 1.43 1.73 1.41 Waste Composition 2021 2020 1 2019 1 2021 2020 2019 1 Total Waste Generated 0.635 0.669 0.717 0.775 0.709 0.710 Energy Recovery 0.262 0.355 0.367 0.038 0.029 0.029 Landfill 0.014 0.011 0.024 0.255 0.284 0.285 Combustion 0.193 0.173 0.197 0.385 0.309 0.296 Flare 0.024 0.021 0.023 Waste to Wastewater 0.073 0.043 0.027 0.056 0.058 0.051 Underground Injection 0.002 0.001 0.002 0.012 0.000 0.000 Other Treatment 0.067 0.065 0.077 0.029 0.029 0.049 1 The prior year data was restated by an immaterial amount. Although the total waste generated in 2021 has increased slightly over 2020 due to unplanned events, the volume of hazardous waste decreased relative to 2020. 306-3 (2016) Significant Spills Description 2021 2020 2019 Process Safety Containment Events 26 29 25 Process Safety Containment Event (PSCE) 2025 Goal Curve – target line on the chart is equivalent to the 2025 goal line utilized in WLO metrics. The PSCE metric, which started in 2016, is derived from an industry best practice, American Petroleum Institute (API) developed and recommended practice (RP) 754-Process Safety Performance Indicators for the Refining and Petrochemical Industries. As an industry leader in sustainability performance, we have been heavily involved in the development of this metric. We believe aligning to this measure will help us achieve an even higher level of performance related to the containment and control of the materials we handle and produce. Process Safety Containment Event 2025 Goal Curve 100 80 60 40 20 0 2025 2024 2023 2022 2021 2020 2019 2018 2017 2016 2015 Baseline PSCE L1 + L2 Count Target
 ESG Report | Dow Page 146 Page 148