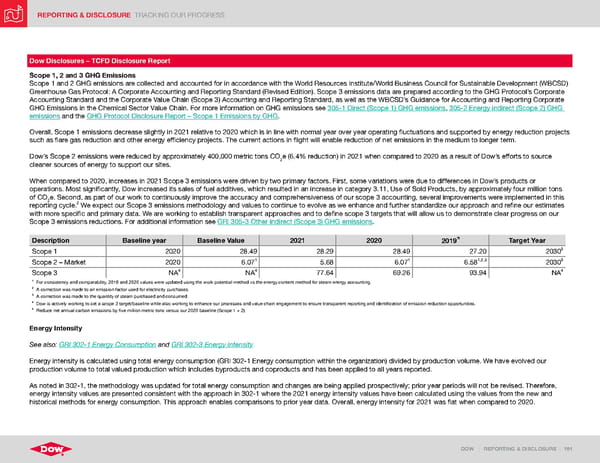
REPORTING & DISCLOSURE TRACKING OUR PROGRESS DOW | REPORTING & DISCLOSURE | 191 Dow Disclosures – TCFD Disclosure Report Scope 1, 2 and 3 GHG Emissions Scope 1 and 2 GHG emissions are collected and accounted for in accordance with the World Resources Institute/World Business Council for Sustainable Development (WBCSD) Greenhouse Gas Protocol: A Corporate Accounting and Reporting Standard (Revised Edition). Scope 3 emissions data are prepared according to the GHG Protocol’s Corporate Accounting Standard and the Corporate Value Chain (Scope 3) Accounting and Reporting Standard, as well as the WBCSD’s Guidance for Accounting and Reporting Corporate GHG Emissions in the Chemical Sector Value Chain. For more information on GHG emissions see 305-1 Direct (Scope 1) GHG emissions , 305-2 Energy indirect (Scope 2) GHG emissions and the GHG Protocol Disclosure Report – Scope 1 Emissions by GHG . Overall, Scope 1 emissions decrease slightly in 2021 relative to 2020 which is in line with normal year over year operating fluctuations and supported by energy reduction projects such as flare gas reduction and other energy efficiency projects. The current actions in flight will enable reduction of net emissions in the medium to longer term. Dow’s Scope 2 emissions were reduced by approximately 400,000 metric tons CO 2 e (6.4% reduction) in 2021 when compared to 2020 as a result of Dow’s efforts to source cleaner sources of energy to support our sites. When compared to 2020, increases in 2021 Scope 3 emissions were driven by two primary factors. First, some variations were due to differences in Dow’s products or operations. Most significantly, Dow increased its sales of fuel additives, which resulted in an increase in category 3.11, Use of Sold Products, by approximately four million tons of CO 2 e. Second, as part of our work to continuously improve the accuracy and comprehensiveness of our scope 3 accounting, several improvements were implemented in this reporting cycle. 2 We expect our Scope 3 emissions methodology and values to continue to evolve as we enhance and further standardize our approach and refine our estimates with more specific and primary data. We are working to establish transparent approaches and to define scope 3 targets that will allow us to demonstrate clear progress on our Scope 3 emissions reductions. For additional information see GRI 305-3 Other indirect (Scope 3) GHG emissions . Description Baseline year Baseline Value 2021 2020 2019 Target Year Scope 1 2020 28.49 28.29 28.49 27.20 2030 5 Scope 2 – Market 2020 6.07 1 5.68 6.07 1 6.58 1,2,3 2030 5 Scope 3 NA 4 NA 4 77.64 69.26 93.94 NA 4 1 For consistency and comparability, 2019 and 2020 values were updated using the work potential method vs the energy content method for steam energy accounting. 2 A correction was made to an emission factor used for electricity purchases. 3 A correction was made to the quantity of steam purchased and consumed. 4 Dow is actively working to set a scope 3 target/baseline while also working to enhance our processes and value chain engagement to ensure transparent reporting and identification of emission reduction opportunities. 5 Reduce net annual carbon emissions by five million metric tons versus our 2020 baseline (Scope 1 + 2). Energy Intensity See also: GRI 302-1 Energy Consumption and GRI 302-3 Energy Intensity Energy intensity is calculated using total energy consumption (GRI 302-1 Energy consumption within the organization) divided by production volume. We have evolved our production volume to total valued production which includes byproducts and coproducts and has been applied to all years reported. As noted in 302-1, the methodology was updated for total energy consumption and changes are being applied prospectively; prior year periods will not be revised. Therefore, energy intensity values are presented consistent with the approach in 302-1 where the 2021 energy intensity values have been calculated using the values from the new and historical methods for energy consumption. This approach enables comparisons to prior year data. Overall, energy intensity for 2021 was flat when compared to 2020.
 ESG Report | Dow Page 190 Page 192