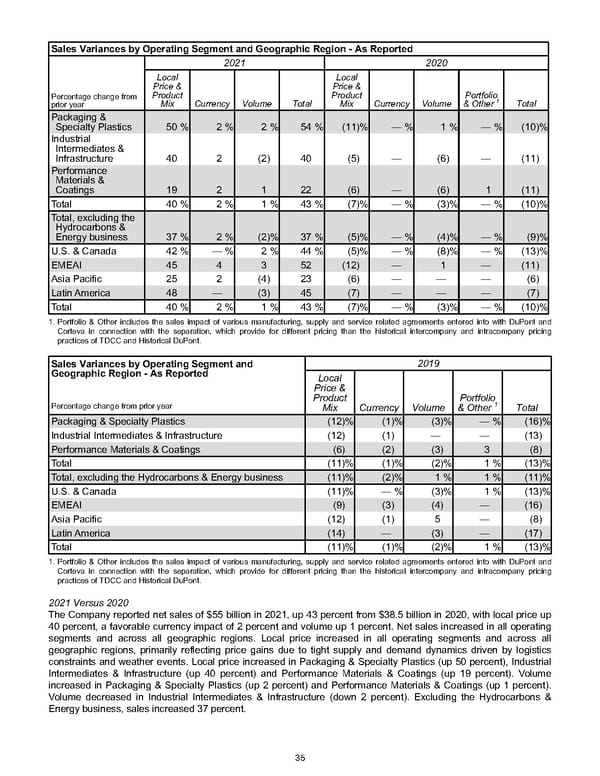
Sales Variances by Operating Segment and Geographic Region - As Reported 2021 2020 Percentage change from prior year Local Price & Product Mix Currency Volume Total Local Price & Product Mix Currency Volume Portfolio & Other 1 Total Packaging & Specialty Plastics 50 % 2 % 2 % 54 % (11) % — % 1 % — % (10) % Industrial Intermediates & Infrastructure 40 2 (2) 40 (5) — (6) — (11) Performance Materials & Coatings 19 2 1 22 (6) — (6) 1 (11) Total 40 % 2 % 1 % 43 % (7) % — % (3) % — % (10) % Total, excluding the Hydrocarbons & Energy business 37 % 2 % (2) % 37 % (5) % — % (4) % — % (9) % U.S. & Canada 42 % — % 2 % 44 % (5) % — % (8) % — % (13) % EMEAI 45 4 3 52 (12) — 1 — (11) Asia Pacific 25 2 (4) 23 (6) — — — (6) Latin America 48 — (3) 45 (7) — — — (7) Total 40 % 2 % 1 % 43 % (7) % — % (3) % — % (10) % 1. Portfolio & Other includes the sales impact of various manufacturing, supply and service related agreements entered into with DuPont and Corteva in connection with the separation, which provide for different pricing than the historical intercompany and intracompany pricing practices of TDCC and Historical DuPont. Sales Variances by Operating Segment and Geographic Region - As Reported Percentage change from prior year 2019 Local Price & Product Mix Currency Volume Portfolio & Other 1 Total Packaging & Specialty Plastics (12) % (1) % (3) % — % (16) % Industrial Intermediates & Infrastructure (12) (1) — — (13) Performance Materials & Coatings (6) (2) (3) 3 (8) Total (11) % (1) % (2) % 1 % (13) % Total, excluding the Hydrocarbons & Energy business (11) % (2) % 1 % 1 % (11) % U.S. & Canada (11) % — % (3) % 1 % (13) % EMEAI (9) (3) (4) — (16) Asia Pacific (12) (1) 5 — (8) Latin America (14) — (3) — (17) Total (11) % (1) % (2) % 1 % (13) % 1. Portfolio & Other includes the sales impact of various manufacturing, supply and service related agreements entered into with DuPont and Corteva in connection with the separation, which provide for different pricing than the historical intercompany and intracompany pricing practices of TDCC and Historical DuPont. 2021 Versus 2020 The Company reported net sales of $55 billion in 2021, up 43 percent from $38.5 billion in 2020, with local price up 40 percent, a favorable currency impact of 2 percent and volume up 1 percent. Net sales increased in all operating segments and across all geographic regions. Local price increased in all operating segments and across all geographic regions, primarily reflecting price gains due to tight supply and demand dynamics driven by logistics constraints and weather events. Local price increased in Packaging & Specialty Plastics (up 50 percent), Industrial Intermediates & Infrastructure (up 40 percent) and Performance Materials & Coatings (up 19 percent). Volume increased in Packaging & Specialty Plastics (up 2 percent) and Performance Materials & Coatings (up 1 percent). Volume decreased in Industrial Intermediates & Infrastructure (down 2 percent). Excluding the Hydrocarbons & Energy business, sales increased 37 percent. 35
 Annual Report Page 44 Page 46