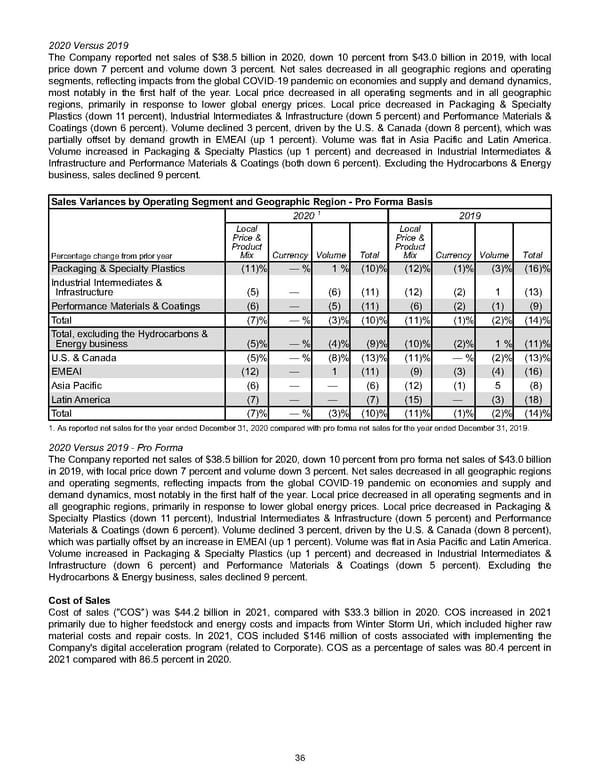
2020 Versus 2019 The Company reported net sales of $38.5 billion in 2020, down 10 percent from $43.0 billion in 2019, with local price down 7 percent and volume down 3 percent. Net sales decreased in all geographic regions and operating segments, reflecting impacts from the global COVID-19 pandemic on economies and supply and demand dynamics, most notably in the first half of the year. Local price decreased in all operating segments and in all geographic regions, primarily in response to lower global energy prices. Local price decreased in Packaging & Specialty Plastics (down 11 percent), Industrial Intermediates & Infrastructure (down 5 percent) and Performance Materials & Coatings (down 6 percent). Volume declined 3 percent, driven by the U.S. & Canada (down 8 percent), which was partially offset by demand growth in EMEAI (up 1 percent). Volume was flat in Asia Pacific and Latin America. Volume increased in Packaging & Specialty Plastics (up 1 percent) and decreased in Industrial Intermediates & Infrastructure and Performance Materials & Coatings (both down 6 percent). Excluding the Hydrocarbons & Energy business, sales declined 9 percent. Sales Variances by Operating Segment and Geographic Region - Pro Forma Basis 2020 1 2019 Percentage change from prior year Local Price & Product Mix Currency Volume Total Local Price & Product Mix Currency Volume Total Packaging & Specialty Plastics (11) % — % 1 % (10) % (12) % (1) % (3) % (16) % Industrial Intermediates & Infrastructure (5) — (6) (11) (12) (2) 1 (13) Performance Materials & Coatings (6) — (5) (11) (6) (2) (1) (9) Total (7) % — % (3) % (10) % (11) % (1) % (2) % (14) % Total, excluding the Hydrocarbons & Energy business (5) % — % (4) % (9) % (10) % (2) % 1 % (11) % U.S. & Canada (5) % — % (8) % (13) % (11) % — % (2) % (13) % EMEAI (12) — 1 (11) (9) (3) (4) (16) Asia Pacific (6) — — (6) (12) (1) 5 (8) Latin America (7) — — (7) (15) — (3) (18) Total (7) % — % (3) % (10) % (11) % (1) % (2) % (14) % 1. As reported net sales for the year ended December 31, 2020 compared with pro forma net sales for the year ended December 31, 2019 . 2020 Versus 2019 - Pro Forma The Company reported net sales of $38.5 billion for 2020, down 10 percent from pro forma net sales of $43.0 billion in 2019, with local price down 7 percent and volume down 3 percent. Net sales decreased in all geographic regions and operating segments, reflecting impacts from the global COVID-19 pandemic on economies and supply and demand dynamics, most notably in the first half of the year. Local price decreased in all operating segments and in all geographic regions, primarily in response to lower global energy prices. Local price decreased in Packaging & Specialty Plastics (down 11 percent), Industrial Intermediates & Infrastructure (down 5 percent) and Performance Materials & Coatings (down 6 percent). Volume declined 3 percent, driven by the U.S. & Canada (down 8 percent), which was partially offset by an increase in EMEAI (up 1 percent). Volume was flat in Asia Pacific and Latin America. Volume increased in Packaging & Specialty Plastics (up 1 percent) and decreased in Industrial Intermediates & Infrastructure (down 6 percent) and Performance Materials & Coatings (down 5 percent). Excluding the Hydrocarbons & Energy business, sales declined 9 percent. Cost of Sales Cost of sales ("COS") was $44.2 billion in 2021 , compared with $33.3 billion in 2020 . COS increased in 2021 primarily due to higher feedstock and energy costs and impacts from Winter Storm Uri, which included higher raw material costs and repair costs. In 2021 , COS included $146 million of costs associated with implementing the Company's digital acceleration program (related to Corporate). COS as a percentage of sales was 80.4 percent in 2021 compared with 86.5 percent in 2020 . 36
 Annual Report Page 45 Page 47