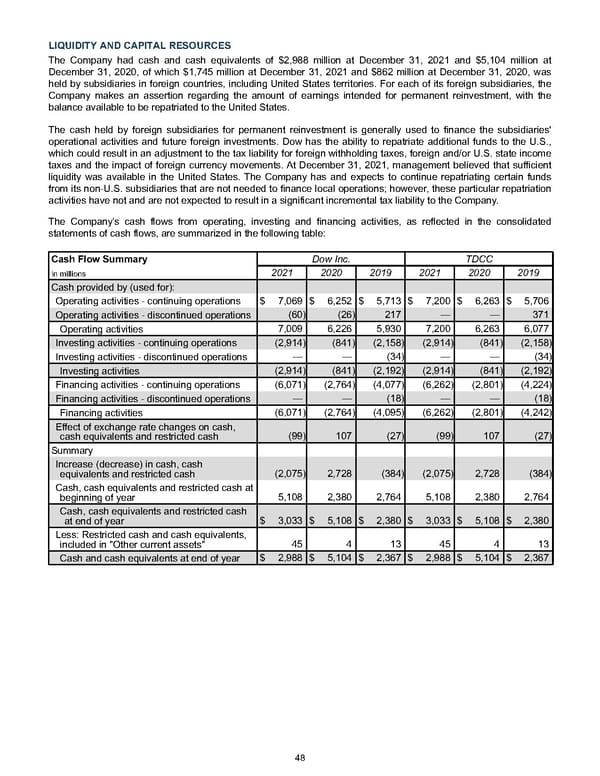
LIQUIDITY AND CAPITAL RESOURCES The Company had cash and cash equivalents of $2,988 million at December 31, 2021 and $5,104 million at December 31, 2020 , of which $1,745 million at December 31, 2021 and $862 million at December 31, 2020 , was held by subsidiaries in foreign countries, including United States territories. For each of its foreign subsidiaries, the Company makes an assertion regarding the amount of earnings intended for permanent reinvestment, with the balance available to be repatriated to the United States. The cash held by foreign subsidiaries for permanent reinvestment is generally used to finance the subsidiaries' operational activities and future foreign investments. Dow has the ability to repatriate additional funds to the U.S., which could result in an adjustment to the tax liability for foreign withholding taxes, foreign and/or U.S. state income taxes and the impact of foreign currency movements. At December 31, 2021 , management believed that sufficient liquidity was available in the United States. The Company has and expects to continue repatriating certain funds from its non-U.S. subsidiaries that are not needed to finance local operations; however, these particular repatriation activities have not and are not expected to result in a significant incremental tax liability to the Company. The Company’s cash flows from operating, investing and financing activities, as reflected in the consolidated statements of cash flows, are summarized in the following table: Cash Flow Summary Dow Inc. TDCC In millions 2021 2020 2019 2021 2020 2019 Cash provided by (used for): Operating activities - continuing operations $ 7,069 $ 6,252 $ 5,713 $ 7,200 $ 6,263 $ 5,706 Operating activities - discontinued operations (60) (26) 217 — — 371 Operating activities 7,009 6,226 5,930 7,200 6,263 6,077 Investing activities - continuing operations (2,914) (841) (2,158) (2,914) (841) (2,158) Investing activities - discontinued operations — — (34) — — (34) Investing activities (2,914) (841) (2,192) (2,914) (841) (2,192) Financing activities - continuing operations (6,071) (2,764) (4,077) (6,262) (2,801) (4,224) Financing activities - discontinued operations — — (18) — — (18) Financing activities (6,071) (2,764) (4,095) (6,262) (2,801) (4,242) Effect of exchange rate changes on cash, cash equivalents and restricted cash (99) 107 (27) (99) 107 (27) Summary Increase (decrease) in cash, cash equivalents and restricted cash (2,075) 2,728 (384) (2,075) 2,728 (384) Cash, cash equivalents and restricted cash at beginning of year 5,108 2,380 2,764 5,108 2,380 2,764 Cash, cash equivalents and restricted cash at end of year $ 3,033 $ 5,108 $ 2,380 $ 3,033 $ 5,108 $ 2,380 Less: Restricted cash and cash equivalents, included in "Other current assets" 45 4 13 45 4 13 Cash and cash equivalents at end of year $ 2,988 $ 5,104 $ 2,367 $ 2,988 $ 5,104 $ 2,367 48
 Annual Report Page 57 Page 59