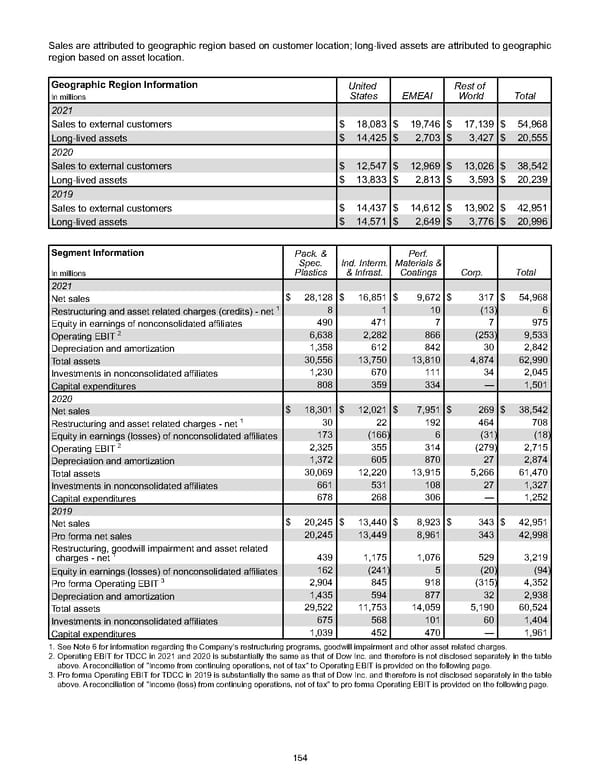
Sales are attributed to geographic region based on customer location; long-lived assets are attributed to geographic region based on asset location. Geographic Region Information United States EMEAI Rest of World Total In millions 2021 Sales to external customers $ 18,083 $ 19,746 $ 17,139 $ 54,968 Long-lived assets $ 14,425 $ 2,703 $ 3,427 $ 20,555 2020 Sales to external customers $ 12,547 $ 12,969 $ 13,026 $ 38,542 Long-lived assets $ 13,833 $ 2,813 $ 3,593 $ 20,239 2019 Sales to external customers $ 14,437 $ 14,612 $ 13,902 $ 42,951 Long-lived assets $ 14,571 $ 2,649 $ 3,776 $ 20,996 Segment Information Pack. & Spec. Plastics Ind. Interm. & Infrast. Perf. Materials & Coatings Corp. Total In millions 2021 Net sales $ 28,128 $ 16,851 $ 9,672 $ 317 $ 54,968 Restructuring and asset related charges (credits) - net 1 8 1 10 (13) 6 Equity in earnings of nonconsolidated affiliates 490 471 7 7 975 Operating EBIT 2 6,638 2,282 866 (253) 9,533 Depreciation and amortization 1,358 612 842 30 2,842 Total assets 30,556 13,750 13,810 4,874 62,990 Investments in nonconsolidated affiliates 1,230 670 111 34 2,045 Capital expenditures 808 359 334 — 1,501 2020 Net sales $ 18,301 $ 12,021 $ 7,951 $ 269 $ 38,542 Restructuring and asset related charges - net 1 30 22 192 464 708 Equity in earnings (losses) of nonconsolidated affiliates 173 (166) 6 (31) (18) Operating EBIT 2 2,325 355 314 (279) 2,715 Depreciation and amortization 1,372 605 870 27 2,874 Total assets 30,069 12,220 13,915 5,266 61,470 Investments in nonconsolidated affiliates 661 531 108 27 1,327 Capital expenditures 678 268 306 — 1,252 2019 Net sales $ 20,245 $ 13,440 $ 8,923 $ 343 $ 42,951 Pro forma net sales 20,245 13,449 8,961 343 42,998 Restructuring, goodwill impairment and asset related charges - net 1 439 1,175 1,076 529 3,219 Equity in earnings (losses) of nonconsolidated affiliates 162 (241) 5 (20) (94) Pro forma Operating EBIT 3 2,904 845 918 (315) 4,352 Depreciation and amortization 1,435 594 877 32 2,938 Total assets 29,522 11,753 14,059 5,190 60,524 Investments in nonconsolidated affiliates 675 568 101 60 1,404 Capital expenditures 1,039 452 470 — 1,961 1. See Note 6 for information regarding the Company's restructuring programs, goodwill impairment and other asset related charges. 2. Operating EBIT for TDCC in 2021 and 2020 is substantially the same as that of Dow Inc. and therefore is not disclosed separately in the table above. A reconciliation of "Income from continuing operations, net of tax" to Operating EBIT is provided on the following page. 3. Pro forma Operating EBIT for TDCC in 2019 is substantially the same as that of Dow Inc. and therefore is not disclosed separately in the table above. A reconciliation of "Income (loss) from continuing operations, net of tax" to pro forma Operating EBIT is provided on the following page. 154
 Annual Report Page 163 Page 165