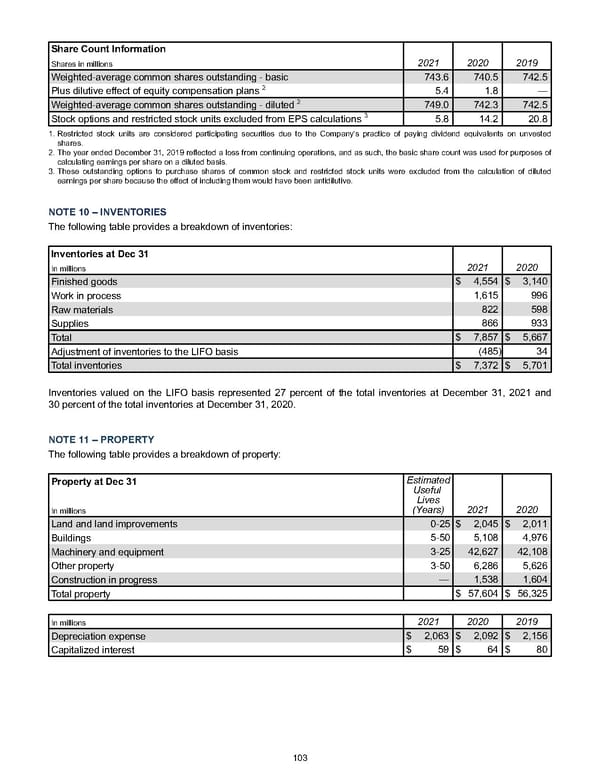
Share Count Information 2021 2020 2019 Shares in millions Weighted-average common shares outstanding - basic 743.6 740.5 742.5 Plus dilutive effect of equity compensation plans 2 5.4 1.8 — Weighted-average common shares outstanding - diluted 2 749.0 742.3 742.5 Stock options and restricted stock units excluded from EPS calculations 3 5.8 14.2 20.8 1. Restricted stock units are considered participating securities due to the Company's practice of paying dividend equivalents on unvested shares. 2. The year ended December 31, 2019 reflected a loss from continuing operations, and as such, the basic share count was used for purposes of calculating earnings per share on a diluted basis. 3. These outstanding options to purchase shares of common stock and restricted stock units were excluded from the calculation of diluted earnings per share because the effect of including them would have been antidilutive. NOTE 10 – INVENTORIES The following table provides a breakdown of inventories: Inventories at Dec 31 In millions 2021 2020 Finished goods $ 4,554 $ 3,140 Work in process 1,615 996 Raw materials 822 598 Supplies 866 933 Total $ 7,857 $ 5,667 Adjustment of inventories to the LIFO basis (485) 34 Total inventories $ 7,372 $ 5,701 Inventories valued on the LIFO basis represented 27 percent of the total inventories at December 31, 2021 and 30 percen t of the total inventories at December 31, 2020 . NOTE 11 – PROPERTY The following table provides a breakdown of property: Property at Dec 31 Estimated Useful Lives (Years) 2021 2020 In millions Land and land improvements 0 - 25 $ 2,045 $ 2,011 Buildings 5 - 50 5,108 4,976 Machinery and equipment 3 - 25 42,627 42,108 Other property 3 - 50 6,286 5,626 Construction in progress — 1,538 1,604 Total property $ 57,604 $ 56,325 In millions 2021 2020 2019 Depreciation expense $ 2,063 $ 2,092 $ 2,156 Capitalized interest $ 59 $ 64 $ 80 103
 Annual Report Page 112 Page 114