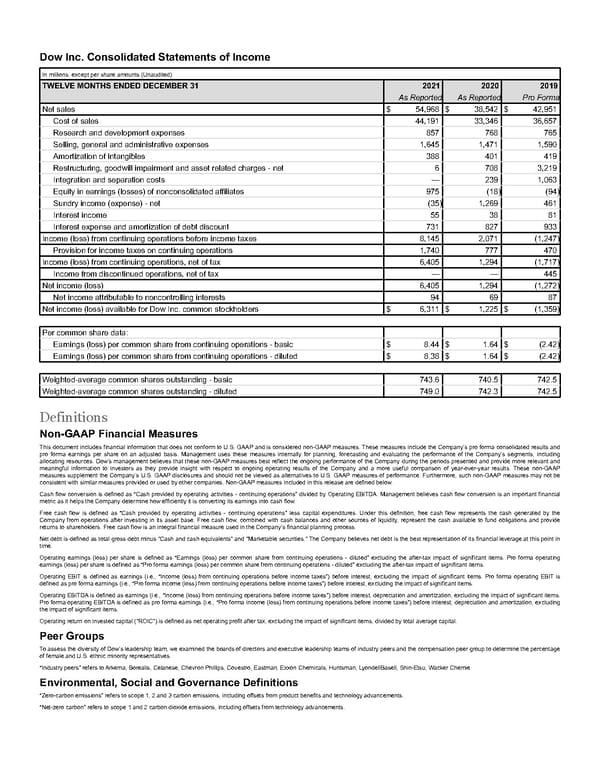
Dow Inc. Consolidated Statements of Income In millions, except per share amounts (Unaudited) TWELVE MONTHS ENDED DECEMBER 31 2021 2020 2019 As Reported As Reported Pro Forma Net sales $ 54,968 $ 38,542 $ 42,951 Cost of sales 44,191 33,346 36,657 Research and development expenses 857 768 765 Selling, general and administrative expenses 1,645 1,471 1,590 Amortization of intangibles 388 401 419 Restructuring, goodwill impairment and asset related charges - net 6 708 3,219 Integration and separation costs — 239 1,063 Equity in earnings (losses) of nonconsolidated affiliates 975 (18) (94) Sundry income (expense) - net (35) 1,269 461 Interest income 55 38 81 Interest expense and amortization of debt discount 731 827 933 Income (loss) from continuing operations before income taxes 8,145 2,071 (1,247) Provision for income taxes on continuing operations 1,740 777 470 Income (loss) from continuing operations, net of tax 6,405 1,294 (1,717) Income from discontinued operations, net of tax — — 445 Net income (loss) 6,405 1,294 (1,272) Net income attributable to noncontrolling interests 94 69 87 Net income (loss) available for Dow Inc. common stockholders $ 6,311 $ 1,225 $ (1,359) Per common share data: Earnings (loss) per common share from continuing operations - basic $ 8.44 $ 1.64 $ (2.42) Earnings (loss) per common share from continuing operations - diluted $ 8.38 $ 1.64 $ (2.42) Weighted-average common shares outstanding - basic 743.6 740.5 742.5 Weighted-average common shares outstanding - diluted 749.0 742.3 742.5 Definitions Non-GAAP Financial Measures This document includes financial information that does not conform to U.S. GAAP and is considered non-GAAP measures. These measures include the Company’s pro forma consolidated results and pro forma earnings per share on an adjusted basis. Management uses these measures internally for planning, forecasting and evaluating the performance of the Company’s segments, including allocating resources. Dow’s management believes that these non-GAAP measures best reflect the ongoing performance of the Company during the periods presented and provide more relevant and meaningful information to investors as they provide insight with respect to ongoing operating results of the Company and a more useful comparison of year-over-year results. These non-GAAP measures supplement the Company’s U.S. GAAP disclosures and should not be viewed as alternatives to U.S. GAAP measures of performance. Furthermore, such non-GAAP measures may not be consistent with similar measures provided or used by other companies. Non-GAAP measures included in this release are defined below. Cash flow conversion is defined as “Cash provided by operating activities - continuing operations” divided by Operating EBITDA. Management believes cash flow conversion is an important financial metric as it helps the Company determine how efficiently it is converting its earnings into cash flow. Free cash flow is defined as “Cash provided by operating activities - continuing operations” less capital expenditures. Under this definition, free cash flow represents the cash generated by the Company from operations after investing in its asset base. Free cash flow, combined with cash balances and other sources of liquidity, represent the cash available to fund obligations and provide returns to shareholders. Free cash flow is an integral financial measure used in the Company’s financial planning process. Net debt is defined as total gross debt minus "Cash and cash equivalents" and "Marketable securities." The Company believes net debt is the best representation of its financial leverage at this point in time. Operating earnings (loss) per share is defined as “Earnings (loss) per common share from continuing operations - diluted” excluding the after-tax impact of significant items. Pro forma operating earnings (loss) per share is defined as “Pro forma earnings (loss) per common share from continuing operations - diluted” excluding the after-tax impact of significant items. Operating EBIT is defined as earnings (i.e., “Income (loss) from continuing operations before income taxes”) before interest, excluding the impact of significant items. Pro forma operating EBIT is defined as pro forma earnings (i.e., “Pro forma income (loss) from continuing operations before income taxes”) before interest, excluding the impact of significant items. Operating EBITDA is defined as earnings (i.e., “Income (loss) from continuing operations before income taxes”) before interest, depreciation and amortization, excluding the impact of significant items. Pro forma operating EBITDA is defined as pro forma earnings (i.e., “Pro forma income (loss) from continuing operations before income taxes”) before interest, depreciation and amortization, excluding the impact of significant items. Operating return on invested capital ("ROIC") is defined as net operating profit after tax, excluding the impact of significant items, divided by total average capital. Peer Groups To assess the diversity of Dow’s leadership team, we examined the boards of directors and executive leadership teams of industry peers and the compensation peer group to determine the percentage of female and U.S. ethnic minority representatives. “Industry peers” refers to Arkema, Borealis, Celanese, Chevron Phillips, Covestro, Eastman, Exxon Chemicals, Huntsman, LyondellBasell, Shin-Etsu, Wacker Chemie Environmental, Social and Governance Definitions “Zero-carbon emissions” refers to scope 1, 2 and 3 carbon emissions, including offsets from product benefits and technology advancements. “Net-zero carbon” refers to scope 1 and 2 carbon dioxide emissions, including offsets from technology advancements.
 Annual Report Page 185 Page 187