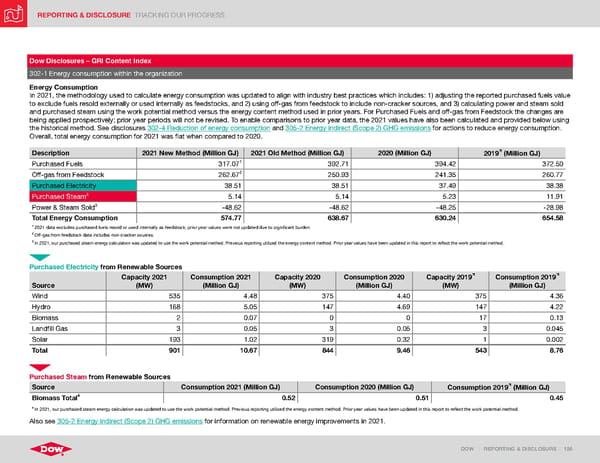
REPORTING & DISCLOSURE TRACKING OUR PROGRESS DOW | REPORTING & DISCLOSURE | 126 Dow Disclosures – GRI Content Index 302-1 Energy consumption within the organization Energy Consumption In 2021, the methodology used to calculate energy consumption was updated to align with industry best practices which includes: 1) adjusting the reported purchased fuels value to exclude fuels resold externally or used internally as feedstocks, and 2) using off-gas from feedstock to include non-cracker sources, and 3) calculating power and steam sold and purchased steam using the work potential method versus the energy content method used in prior years. For Purchased Fuels and off-gas from Feedstock the changes are being applied prospectively; prior year periods will not be revised. To enable comparisons to prior year data, the 2021 values have also been calculated and provided below using the historical method. See disclosures 302-4 Reduction of energy consumption and 305-2 Energy indirect (Scope 2) GHG emissions for actions to reduce energy consumption. Overall, total energy consumption for 2021 was flat when compared to 2020. Description 2021 New Method (Million GJ) 2021 Old Method (Million GJ) 2020 (Million GJ) 2019 (Million GJ) Purchased Fuels 317.07 1 392.71 394.42 372.50 Off-gas from Feedstock 262.67 2 250.93 241.35 260.77 Purchased Electricity 38.51 38.51 37.49 38.38 Purchased Steam 3 5.14 5.14 5.23 11.91 Power & Steam Sold 3 -48.62 -48.62 -48.25 -28.98 Total Energy Consumption 574.77 638.67 630.24 654.58 1 2021 data excludes purchased fuels resold or used internally as feedstock; prior year values were not updated due to significant burden. 2 Off-gas from feedstock data includes non-cracker sources. 3 In 2021, our purchased steam energy calculation was updated to use the work potential method. Previous reporting utilized the energy content method. Prior year values have been updated in this report to reflect the work potential method. Purchased Electricity from Renewable Sources Source Capacity 2021 (MW) Consumption 2021 (Million GJ) Capacity 2020 (MW) Consumption 2020 (Million GJ) Capacity 2019 (MW) Consumption 2019 (Million GJ) Wind 535 4.48 375 4.40 375 4.36 Hydro 168 5.05 147 4.69 147 4.22 Biomass 2 0.07 0 0 17 0.13 Landfill Gas 3 0.05 3 0.05 3 0.045 Solar 193 1.02 319 0.32 1 0.002 Total 901 10.67 844 9.46 543 8.76 Purchased Steam from Renewable Sources Source Consumption 2021 (Million GJ) Consumption 2020 (Million GJ) Consumption 2019 (Million GJ) Biomass Total 4 0.52 0.51 0.45 4 In 2021, our purchased steam energy calculation was updated to use the work potential method. Previous reporting utilized the energy content method. Prior year values have been updated in this report to reflect the work potential method. Also see 305-2 Energy indirect (Scope 2) GHG emissions for information on renewable energy improvements in 2021.
 ESG Report | Dow Page 125 Page 127