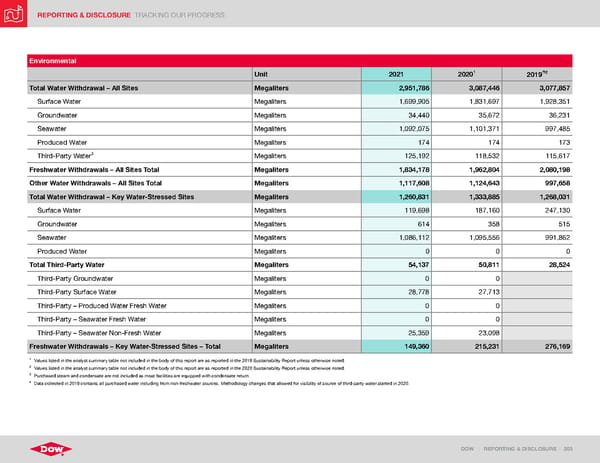
REPORTING & DISCLOSURE TRACKING OUR PROGRESS DOW | REPORTING & DISCLOSURE | 203 Environmental Unit 2021 2020 1 2019 2 Total Water Withdrawal – All Sites Megaliters 2,951,786 3,087,446 3,077,857 Surface Water Megaliters 1,699,905 1,831,697 1,928,351 Groundwater Megaliters 34,440 35,672 36,231 Seawater Megaliters 1,092,075 1,101,371 997,485 Produced Water Megaliters 174 174 173 Third-Party Water 3 Megaliters 125,192 118,532 115,617 Freshwater Withdrawals – All Sites Total Megaliters 1,834,178 1,962,804 2,080,198 Other Water Withdrawals – All Sites Total Megaliters 1,117,608 1,124,643 997,658 Total Water Withdrawal – Key Water-Stressed Sites Megaliters 1,260,831 1,333,885 1,268,031 Surface Water Megaliters 119,698 187,160 247,130 Groundwater Megaliters 614 358 515 Seawater Megaliters 1,086,112 1,095,556 991,862 Produced Water Megaliters 0 0 0 Total Third-Party Water Megaliters 54,137 50,811 28,524 Third-Party Groundwater Megaliters 0 0 Third-Party Surface Water Megaliters 28,778 27,713 Third-Party – Produced Water Fresh Water Megaliters 0 0 Third-Party – Seawater Fresh Water Megaliters 0 0 Third-Party – Seawater Non-Fresh Water Megaliters 25,359 23,098 Freshwater Withdrawals – Key Water-Stressed Sites – Total Megaliters 149,360 215,231 276,169 1 Values listed in the analyst summary table not included in the body of this report are as reported in the 2019 Sustainability Report unless otherwise noted. 2 Values listed in the analyst summary table not included in the body of this report are as reported in the 2020 Sustainability Report unless otherwise noted. 3 Purchased steam and condensate are not included as most facilities are equipped with condensate return. 4 Data collected in 2019 contains all purchased water including from non-freshwater sources. Methodology changes that allowed for visibility of source of third-party water started in 2020.
 ESG Report | Dow Page 202 Page 204