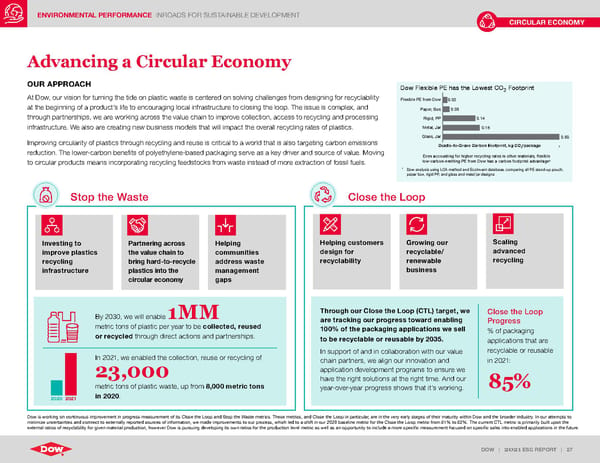
ENVIRONMENTAL PERFORMANCE INROADS FOR SUSTAINABLE DEVELOPMENT DOW | 2021 ESG REPORT | 27 CIRCULAR ECONOMY Advancing a Circular Economy OUR APPROACH At Dow, our vision for turning the tide on plastic waste is centered on solving challenges from designing for recyclability at the beginning of a product’s life to encouraging local infrastructure to closing the loop. The issue is complex, and through partnerships, we are working across the value chain to improve collection, access to recycling and processing infrastructure. We also are creating new business models that will impact the overall recycling rates of plastics. Improving circularity of plastics through recycling and reuse is critical to a world that is also targeting carbon emissions reduction. The lower-carbon benefits of polyethylene-based packaging serve as a key driver and source of value. Moving to circular products means incorporating recycling feedstocks from waste instead of more extraction of fossil fuels. Investing to improve plastics recycling infrastructure Helping communities address waste management gaps Partnering across the value chain to bring hard-to-recycle plastics into the circular economy Helping customers design for recyclability Growing our recyclable/ renewable business Scaling advanced recycling Close the Loop Stop the Waste By 2030, we will enable 1MM metric tons of plastic per year to be collected, reused or recycled through direct actions and partnerships. In 2021, we enabled the collection, reuse or recycling of 23,000 metric tons of plastic waste, up from 8,000 metric tons in 2020 . 2020 2021 Through our Close the Loop (CTL) target, we are tracking our progress toward enabling 100% of the packaging applications we sell to be recyclable or reusable by 2035. In support of and in collaboration with our value chain partners, we align our innovation and application development programs to ensure we have the right solutions at the right time. And our year-over-year progress shows that it’s working. Close the Loop Progress % of packaging applications that are recyclable or reusable i n 2021: 85% Dow is working on continuous improvement in progress measurement of its Close the Loop and Stop the Waste metrics. These metrics, and Close the Loop in particular, are in the very early stages of their maturity within Dow and the broader industry. In our attempts to minimize uncertainties and connect to externally reported sources of information, we made improvements to our process, which led to a shift in our 2020 baseline metric for the Close the Loop metric from 81% to 82%. The current CTL metric is primarily built upon the external ratios of recyclability for given material production, however Dow is pursuing developing its own ratios for the production level metric as well as an opportunity to include a more specific measurement focused on specific sales into enabled applications in the future. 0.02 0.03 0.14 0.16 0.50 Flexible PE from Dow Paper, Box Rigid, PP Metal, Jar Glass, Jar Cradle-to-Grave Carbon Footprint, kg CO 2 /package Even accounting for higher recycling rates in other materials, flexible low-carbon-emitting PE from Dow has a carbon footprint advantage 1 Dow Flexible PE has the Lowest CO 2 Footprint 1 Dow analysis using LCA method and EcoInvent database, comparing all PE stand-up pouch, paper box, rigid PP, and glass and metal jar designs
 ESG Report | Dow Page 26 Page 28