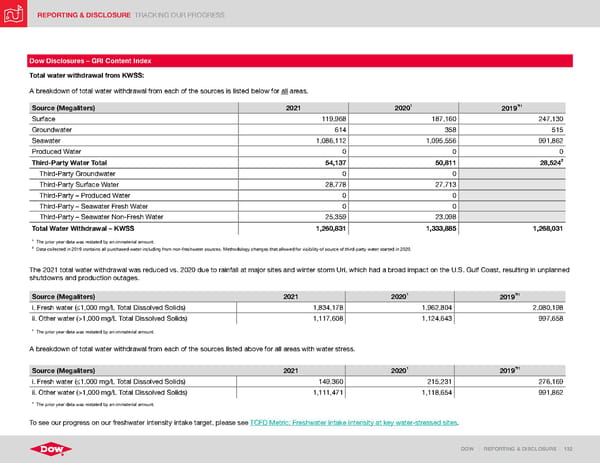
REPORTING & DISCLOSURE TRACKING OUR PROGRESS DOW | REPORTING & DISCLOSURE | 132 Dow Disclosures – GRI Content Index Total water withdrawal from KWSS: A breakdown of total water withdrawal from each of the sources is listed below for all areas. Source (Megaliters) 2021 2020 1 2019 1 Surface 119,968 187,160 247,130 Groundwater 614 358 515 Seawater 1,086,112 1,095,556 991,862 Produced Water 0 0 0 Third-Party Water Total 54,137 50,811 28,524 2 Third-Party Groundwater 0 0 Third-Party Surface Water 28,778 27,713 Third-Party – Produced Water 0 0 Third-Party – Seawater Fresh Water 0 0 Third-Party – Seawater Non-Fresh Water 25,359 23,098 Total Water Withdrawal – KWSS 1,260,831 1,333,885 1,268,031 1 The prior year data was restated by an immaterial amount. 2 Data collected in 2019 contains all purchased water including from non-freshwater sources. Methodology changes that allowed for visibility of source of third-party water started in 2020. The 2021 total water withdrawal was reduced vs. 2020 due to rainfall at major sites and winter storm Uri, which had a broad impact on the U.S. Gulf Coast, resulting in unplanned shutdowns and production outages. Source (Megaliters) 2021 2020 1 2019 1 i. Fresh water (≤1,000 mg/L Total Dissolved Solids) 1,834,178 1,962,804 2,080,198 ii. Other water (>1,000 mg/L Total Dissolved Solids) 1,117,608 1,124,643 997,658 1 The prior year data was restated by an immaterial amount. A breakdown of total water withdrawal from each of the sources listed above for all areas with water stress. Source (Megaliters) 2021 2020 1 2019 1 i. Fresh water (≤1,000 mg/L Total Dissolved Solids) 149,360 215,231 276,169 ii. Other water (>1,000 mg/L Total Dissolved Solids) 1,111,471 1,118,654 991,862 1 The prior year data was restated by an immaterial amount. To see our progress on our freshwater intensity intake target, please see TCFD Metric: Freshwater intake intensity at key water-stressed sites .
 ESG Report | Dow Page 131 Page 133