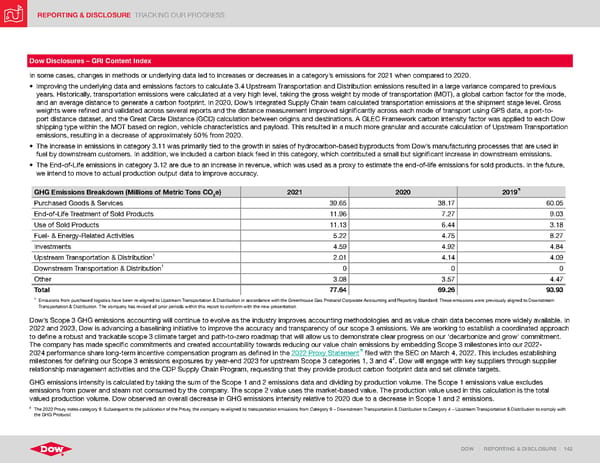
REPORTING & DISCLOSURE TRACKING OUR PROGRESS DOW | REPORTING & DISCLOSURE | 142 Dow Disclosures – GRI Content Index In some cases, changes in methods or underlying data led to increases or decreases in a category’s emissions for 2021 when compared to 2020. • Improving the underlying data and emissions factors to calculate 3.4 Upstream Transportation and Distribution emissions resulted in a large variance compared to previous years. Historically, transportation emissions were calculated at a very high level, taking the gross weight by mode of transportation (MOT), a global carbon factor for the mode, and an average distance to generate a carbon footprint. In 2020, Dow’s Integrated Supply Chain team calculated transportation emissions at the shipment stage level. Gross weights were refined and validated across several reports and the distance measurement improved significantly across each mode of transport using GPS data, a port-to- port distance dataset, and the Great Circle Distance (GCD) calculation between origins and destinations. A GLEC Framework carbon intensity factor was applied to each Dow shipping type within the MOT based on region, vehicle characteristics and payload. This resulted in a much more granular and accurate calculation of Upstream Transportation emissions, resulting in a decrease of approximately 50% from 2020. • The increase in emissions in category 3.11 was primarily tied to the growth in sales of hydrocarbon-based byproducts from Dow’s manufacturing processes that are used in fuel by downstream customers. In addition, we included a carbon black feed in this category, which contributed a small but significant increase in downstream emissions. • The End-of-Life emissions in category 3.12 are due to an increase in revenue, which was used as a proxy to estimate the end-of-life emissions for sold products. In the future, we intend to move to actual production output data to improve accuracy. GHG Emissions Breakdown (Millions of Metric Tons CO 2 e) 2021 2020 2019 Purchased Goods & Services 39.65 38.17 60.05 End-of-Life Treatment of Sold Products 11.96 7.27 9.03 Use of Sold Products 11.13 6.44 3.18 Fuel- & Energy-Related Activities 5.22 4.75 8.27 Investments 4.59 4.92 4.84 Upstream Transportation & Distribution 1 2.01 4.14 4.09 Downstream Transportation & Distribution 1 0 0 0 Other 3.08 3.57 4.47 Total 77.64 69.26 93.93 1 Emissions from purchased logistics have been re-aligned to Upstream Transportation & Distribution in accordance with the Greenhouse Gas Protocol Corporate Accounting and Reporting Standard. These emissions were previously aligned to Downstream Transportation & Distribution. The company has revised all prior periods within this report to conform with the new presentation. Dow’s Scope 3 GHG emissions accounting will continue to evolve as the industry improves accounting methodologies and as value chain data becomes more widely available. In 2022 and 2023, Dow is advancing a baselining initiative to improve the accuracy and transparency of our scope 3 emissions. We are working to establish a coordinated approach to define a robust and trackable scope 3 climate target and path-to-zero roadmap that will allow us to demonstrate clear progress on our ‘decarbonize and grow’ commitment. The company has made specific commitments and created accountability towards reducing our value chain emissions by embedding Scope 3 milestones into our 2022- 2024 performance share long-term incentive compensation program as defined in the 2022 Proxy Statement filed with the SEC on March 4, 2022. This includes establishing milestones for defining our Scope 3 emissions exposures by year-end 2023 for upstream Scope 3 categories 1, 3 and 4 2 . Dow will engage with key suppliers through supplier relationship management activities and the CDP Supply Chain Program, requesting that they provide product carbon footprint data and set climate targets. GHG emissions intensity is calculated by taking the sum of the Scope 1 and 2 emissions data and dividing by production volume. The Scope 1 emissions value excludes emissions from power and steam not consumed by the company. The scope 2 value uses the market-based value. The production value used in this calculation is the total valued production volume. Dow observed an overall decrease in GHG emissions intensity relative to 2020 due to a decrease in Scope 1 and 2 emissions. 2 The 2022 Proxy notes category 9. Subsequent to the publication of the Proxy, the company re-aligned its transportation emissions from Category 9 – Downstream Transportation & Distribution to Category 4 – Upstream Transportation & Distribution to comply with the GHG Protocol.
 ESG Report | Dow Page 141 Page 143