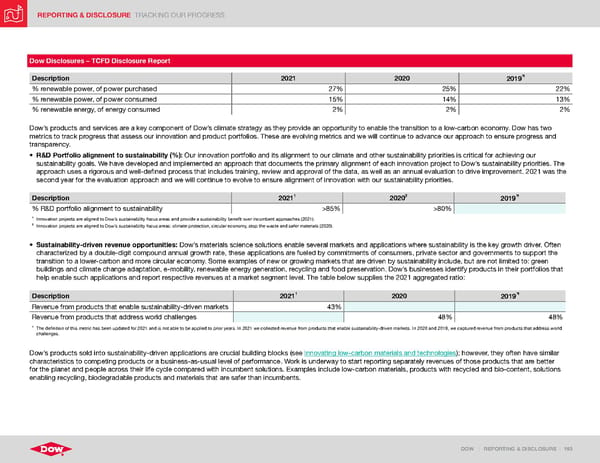
REPORTING & DISCLOSURE TRACKING OUR PROGRESS DOW | REPORTING & DISCLOSURE | 193 Dow Disclosures – TCFD Disclosure Report Description 2021 2020 2019 % renewable power, of power purchased 27% 25% 22% % renewable power, of power consumed 15% 14% 13% % renewable energy, of energy consumed 2% 2% 2% Dow’s products and services are a key component of Dow’s climate strategy as they provide an opportunity to enable the transition to a low-carbon economy. Dow has two metrics to track progress that assess our innovation and product portfolios. These are evolving metrics and we will continue to advance our approach to ensure progress and transparency. • R&D Portfolio alignment to sustainability (%): Our innovation portfolio and its alignment to our climate and other sustainability priorities is critical for achieving our sustainability goals. We have developed and implemented an approach that documents the primary alignment of each innovation project to Dow’s sustainability priorities. The approach uses a rigorous and well-defined process that includes training, review and approval of the data, as well as an annual evaluation to drive improvement. 2021 was the second year for the evaluation approach and we will continue to evolve to ensure alignment of innovation with our sustainability priorities. Description 2021 1 2020 2 2019 % R&D portfolio alignment to sustainability >85% >80% 1 Innovation projects are aligned to Dow’s sustainability focus areas and provide a sustainability benefit over incumbent approaches (2021). 2 Innovation projects are aligned to Dow’s sustainability focus areas: climate protection, circular economy, stop the waste and safer materials (2020). • Sustainability-driven revenue opportunities: Dow’s materials science solutions enable several markets and applications where sustainability is the key growth driver. Often characterized by a double-digit compound annual growth rate, these applications are fueled by commitments of consumers, private sector and governments to support the transition to a lower-carbon and more circular economy. Some examples of new or growing markets that are driven by sustainability include, but are not limited to: green buildings and climate change adaptation, e-mobility, renewable energy generation, recycling and food preservation. Dow’s businesses identify products in their portfolios that help enable such applications and report respective revenues at a market segment level. The table below supplies the 2021 aggregated ratio: Description 2021 1 2020 2019 Revenue from products that enable sustainability-driven markets 43% Revenue from products that address world challenges 48% 48% 1 The definition of this metric has been updated for 2021 and is not able to be applied to prior years. In 2021 we collected revenue from products that enable sustainability-driven markets. In 2020 and 2019, we captured revenue from products that address world challenges. Dow’s products sold into sustainability-driven applications are crucial building blocks (see Innovating low-carbon materials and technologies ); however, they often have similar characteristics to competing products or a business-as-usual level of performance. Work is underway to start reporting separately revenues of those products that are better for the planet and people across their life cycle compared with incumbent solutions. Examples include low-carbon materials, products with recycled and bio-content, solutions enabling recycling, biodegradable products and materials that are safer than incumbents.
 ESG Report | Dow Page 192 Page 194