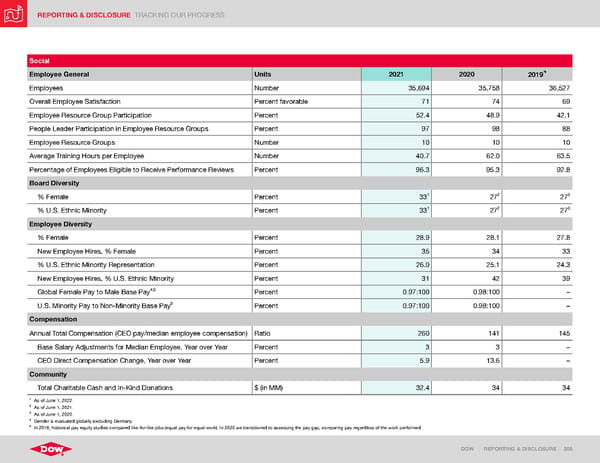
REPORTING & DISCLOSURE TRACKING OUR PROGRESS DOW | REPORTING & DISCLOSURE | 205 Social Employee General Units 2021 2020 2019 Employees Number 35,694 35,758 36,527 Overall Employee Satisfaction Percent favorable 71 74 69 Employee Resource Group Participation Percent 52.4 48.9 42.1 People Leader Participation in Employee Resource Groups Percent 97 98 88 Employee Resource Groups Number 10 10 10 Average Training Hours per Employee Number 40.7 62.0 63.5 Percentage of Employees Eligible to Receive Performance Reviews Percent 96.3 95.3 92.8 Board Diversity % Female Percent 33 1 27 2 27 3 % U.S. Ethnic Minority Percent 33 1 27 2 27 3 Employee Diversity % Female Percent 28.9 28.1 27.8 New Employee Hires, % Female Percent 35 34 33 % U.S. Ethnic Minority Representation Percent 26.0 25.1 24.3 New Employee Hires, % U.S. Ethnic Minority Percent 31 42 39 Global Female Pay to Male Base Pay 4,5 Percent 0.97:100 0.98:100 – U.S. Minority Pay to Non-Minority Base Pay 5 Percent 0.97:100 0.98:100 – Compensation Annual Total Compensation (CEO pay/median employee compensation) Ratio 260 141 145 Base Salary Adjustments for Median Employee, Year over Year Percent 3 3 – CEO Direct Compensation Change, Year over Year Percent 5.9 13.6 – Community Total Charitable Cash and In-Kind Donations $ (in MM) 32.4 34 34 1 As of June 1, 2022. 2 As of June 1, 2021. 3 As of June 1, 2020. 4 Gender is evaluated globally excluding Germany. 5 In 2019, historical pay equity studies compared like-for-like jobs (equal pay for equal work). In 2020 we transitioned to assessing the pay gap, comparing pay regardless of the work performed.
 ESG Report | Dow Page 204 Page 206