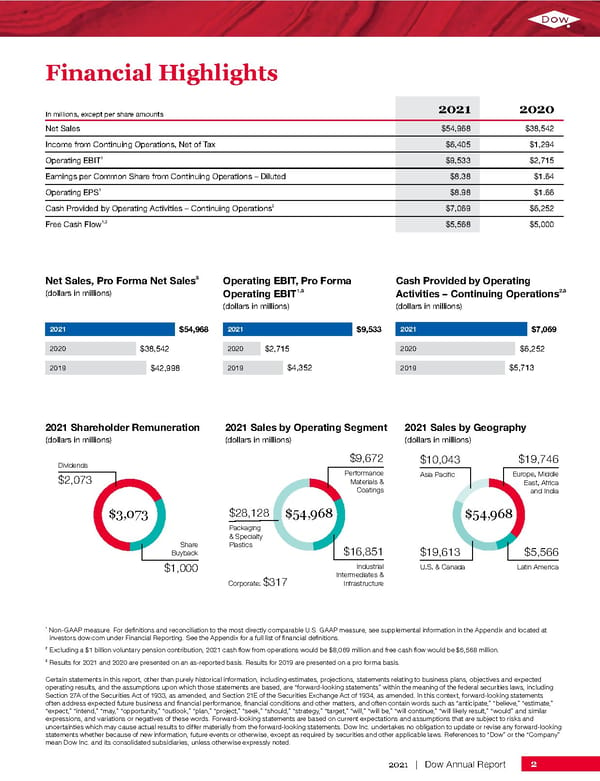
$42,998 $4,352 $5,713 $38,542 $2,715 $6,252 $54,968 $9,533 $7,069 Net Sales, Pro Forma Net Sales 3 (dollars in millions) Operating EBIT, Pro Forma Operating EBIT 1,3 (dollars in millions) Cash Provided by Operating Activities – Continuing Operations 2,3 (dollars in millions) Financial Highlights 1 Non-GAAP measure. For definitions and reconciliation to the most directly comparable U.S. GAAP measure, see supplemental information in the Appendix and located at investors.dow.com under Financial Reporting. See the Appendix for a full list of financial definitions. 2 E xcluding a $1 billion voluntary pension contribution, 2021 cash flow from operations would be $8,069 million and free cash flow would be $6,568 million. 3 R esults for 2021 and 2020 are presented on an as-reported basis. Results for 2019 are presented on a pro forma basis. Certain statements in this report, other than purely historical information, including estimates, projections, statements relating to business plans, objectives and expected operating results, and the assumptions upon which those statements are based, are “forward-looking statements” within the meaning of the federal securities laws, including Section 27A of the Securities Act of 1933, as amended, and Section 21E of the Securities Exchange Act of 1934, as amended. In this context, forward-looking statements often address expected future business and financial performance, financial conditions and other matters, and often contain words such as “anticipate,” “believe,” “estimate,” “expect,” “intend,” “may,” “opportunity,” “outlook,” “plan,” “project,” “seek,” “should,” “strategy,” “target,” “will,” “will be,” “will continue,” “will likely result,” “would” and similar expressions, and variations or negatives of these words. Forward-looking statements are based on current expectations and assumptions that are subject to risks and uncertainties which may cause actual results to differ materially from the forward-looking statements. Dow Inc. undertakes no obligation to update or revise any forward-looking statements whether because of new information, future events or otherwise, except as required by securities and other applicable laws. References to “Dow” or the “Company” mean Dow Inc. and its consolidated subsidiaries, unless otherwise expressly noted. In millions, except per share amounts 2021 2020 Net Sales $54,968 $38,542 Income from Continuing Operations, Net of Tax $6,405 $1,294 Operating EBIT 1 $9,533 $2,715 Earnings per Common Share from Continuing Operations – Diluted $8.38 $1.64 Operating EPS 1 $8.98 $1.66 Cash Provided by Operating Activities – Continuing Operations 2 $7,069 $6,252 Free Cash Flow 1,2 $5,568 $5,000 2 2021 | Dow Annual Report 2021 Sales by Operating Segment (dollars in millions) 2021 Sales by Geography (dollars in millions) 2021 Shareholder Remuneration (dollars in millions) Dividends $2,073 $10,043 Asia Pacific $19,613 U.S. & Canada $19,746 Europe, Middle East, Africa and India $5,566 Latin America Share Buyback $1,000 $3,073 $54,968 Corporate: $317 $28,128 Packaging & Specialty Plastics $9,672 Performance Materials & Coatings $16,851 Industrial Intermediates & Infrastructure $54,968 2021 2020 2019 2021 2020 2019 2021 2020 2019
 Annual Report Page 2 Page 4